AWS Synthetics Canaries - when to bite the bullet
AWS offers a broad variety of services - some of which are essential and unavoidable when using Amazon as a cloud provider.
Others, on the other hand, provide solutions that, whilst on the surface are great as a quick start, do not scale. By scale, I don’t mean in the usual compute-power way, I mean in cost.
If you use a service that provides scalability with a steady and predictable workload, then you are paying for flexibility that you aren’t using - and you do pay for this.
AWS Synthetic Check

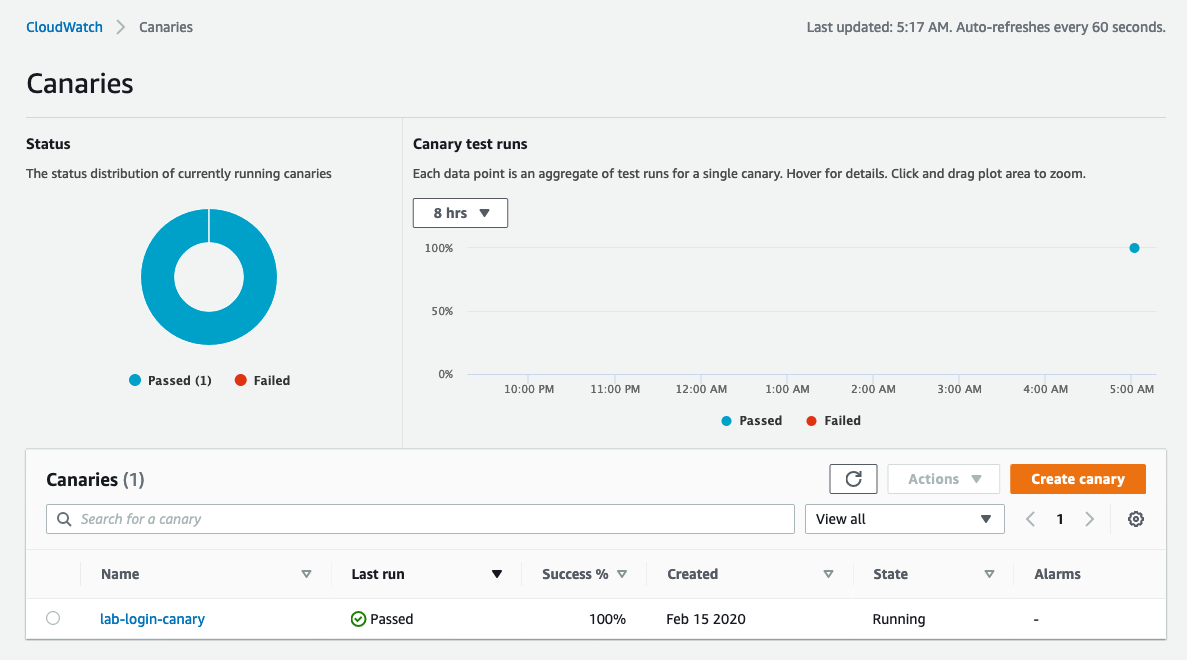
Within the abundance of AWS services, the Canary Checks feature in CloudWatch is the topic I’d like to cover.
This service orchestrates regular synthetic/canary checks for websites and API endpoints.
It requires scripting, utilising AWS’s insistent boilerplate, but the underlying mechanism involves a Lambda function, cron triggers, and a dashboard displaying success/failure metrics.
Priced at $0.0012 per run, on the surface, this service offers a decent simple check for a website.
Costs add up
Whilst this may be fine for small users, who want a single check. But if you want to go further, and have 200+ systems deployed in your stack, all independently wanting to handle a stand-alone external check, this quickly adds up.
You could start by only checking your most important systems (let’s say 50 of the 200) and deploy a check that monitors them every 5 minutes - this will set you back ~$7K/yr.
But, consider the following:
Why have different methods of have independent monitoring for critical and non-critical systems - all systems should have the ability (or requirement!) to have the same level of monitoring.
Should checks be deployed with the applications themselves? For consistency, it is much more beneficial to deploy the same monitoring to non-production environments.
If checks only occur every 5 minutes, this means a single check failure (irrelevant of how short the outage was) would result in minimum SLA drop to 99.98% (over a 30 day period).
This means that a single failed request would result in being unable to achieve 4*9s availability. It also means that an application could have a 4 minute outage without being noticed (at least by the synthetic monitoring).
Increasing the frequency to runs checks every 1 minute would appear to be much more beneficial.
If you apply the above, and monitor all of our 200 systems, across 3 environments and decrease the monitoring interval to every 1 minute, we’d end up with a cost of over $350K!
| Services | Environments | Frequency | Cost (per year) |
|---|---|---|---|
| 1 | 1 | 5 minutes | $126 |
| 50 | 1 | 5 minutes | $6,307 |
| 200 | 1 | 5 minutes | $25,228 |
| 200 | 3 | 5 minutes | $75,686 |
| 200 | 3 | 1 minute | $378,432 |
Get down to earth
Breaking down the annual cost of $350K reveals a substantial expenditure for running a browser to check 200 endpoints every minute.
If we look at this for a single check every 5 minutes - we expect the check to take no more than 1 minute (though this is probably a very high figure, given we’d hope page load times to be much closer to 1 second) and let’s assume that this is limited to 1 CPU core.
This means, for $125/year, we’re effectively getting an instance with 1/5th CPU core. So, let’s assume 5 checks and we’re paying $625/year for an instance with 1 CPU core.
Compare this to an a1.xlarge, which costs ~$635 (reserved) for 4 CPU cores - this means we’re paying ~4X the amount for the instance.
If we’re much more ruthless and demand that each of our checks must complete within 10 seconds, we’re actually paying closer to 24 times the cost. Keeping in mind that this is only taking the AWS Canary execution cost into consideration and not those for Lambda and Cloudwatch.
Crafting an Alternative
To attempt to find an alternative, a search for a more scalable approach led to the development of JMon — a Python-based solution utilizing Celery, Redis, and Postgres.
The main goals of JMon were to be:
- Language agnostic - the checks would be readable and writeable by anyone;
- Tied to applications - the checks would be deployable along with an application - if a core journey is changed in a release, the check would be deployed simultaneously, which would aid with the added checks for each environment;
- Scalable - the solution had to be scalable, allowing systems to be added/removed without having a bottleneck on a single monitoring server that had to scale vertically;
- Extendable - every company uses different tooling for logging, metrics and alerting, so the tool has to support these.
Running an alternative directly on EC2 will give us these great savings and JMon was written with scalability in mind - keeping in mind that checks will generally be consistent and the cluster will only need scaling as new checks are added.
The result of this was JMon (https://github.com/DockStudios/jmon).
Checks are written in YAML, using pre-defined step types ( https://github.com/DockStudios/jmon/blob/main/docs/step_reference.md ), moving away from the AWS enforced use of node or Python. The YAML makes it easy to write checks, but also easy to read when debugging a failed check, for example:
 - goto: https://example.com
 - find:
   - text: Login Button
   - actions:
     - click
 - check:
     title: Login Page
     url: https://example.com/login
JMon uses different methods for performing checks, depending on what the check is attempting to do. For example, a check that loads a webpage and fills out a form, would need to use Selenium. Whereas a check, which loads an API endpoint and checks the response for a particular key, can be executed much more efficiently by completely avoid selenium.
JMon uses s3 for storing artifacts, such as logs and screenshots are stored in S3, Redis for storing metrics and the result data is stored in Postgres.
Terraform Integration
The JMon Terraform provider ( https://github.com/DockStudios/terraform-provider-jmon ) allows checks to be written in Terraform.
A simple check can be written in the following way:
resource "jmon_check" "basic_check" {
  name = "My_Check"

  environment = "dev"

  steps = <<EOF
# Check homepage
- goto: https://en.wikipedia.org/wiki/Main_Page
- check:
    title: Wikipedia, the free encyclopedia
EOF
}
This provides the ability to easily write checks that can be deployed during application deployments and, using the API, can trigger a post-release test to provide a basic smoke test.
External tooling
JMon’s extensibility is highlighted through its plugin system.
Notification plug-ins offer the ability to send logs, notifications, and result metrics to external tools (e.g. https://github.com/DockStudios/jmon/blob/main/jmon/plugins/notifications/example_notification.py ).
Callable plug-ins, on the other hand, provide flexibility during check execution, facilitating interaction with external data sources, such as secret providers for API calls (e.g. https://github.com/DockStudios/jmon/blob/main/jmon/plugins/callable/example_callable_plugin.py ).
Using these plug-ins, functionality can easily introduced to interact with third party products.
Browser efficiency
In local development, using Firefox with a virtual display, a simple check can take around 10 seconds. Given that the check itself is doing practically nothing, that 10 seconds is nearly all startup/shutdown time.
Various work was performed to provide: alternative browsers support, browser caching at runtime and use of headless modes, which resulted in getting this boiler plate time down to 320ms.
Browser plugin
Out of sheer curiosity, I spent a bit of time creating a Chrome plugin, which could record page interactions and generate a JMon check.
Just install the plugin, navigate to desired website, perform the required journey and the plugin spits out the config!
This plugin, is also available here: https://github.com/DockStudios/jmon-chrome-plugin
Cost
If checks are run back-to-back, with an expected 10 second execution time overall, for 200 services across 3 environments, executing every minute, we could consume approximately 100 CPU cores, concurrently (200 services * 3 environments * 1/6 (10 second check every 60 seconds)).
Using the a1.xlarge instances, we could need 25 instances, with a total cost of just under $16K/yr. Compared to the original $350K/yr, this showcases a considerable cost-saving potential!
Though, this doesn’t take into account the costs of a Redis cluster and Postgres RDS, given the relatively small amount of data (for a handful of selects/inserts for 200 checks per minute), this cost is relatively negligible.
This also excludes S3 costs, but the original AWS Synthetic check also excludes this, and they both store logs and screenshots.
Interface
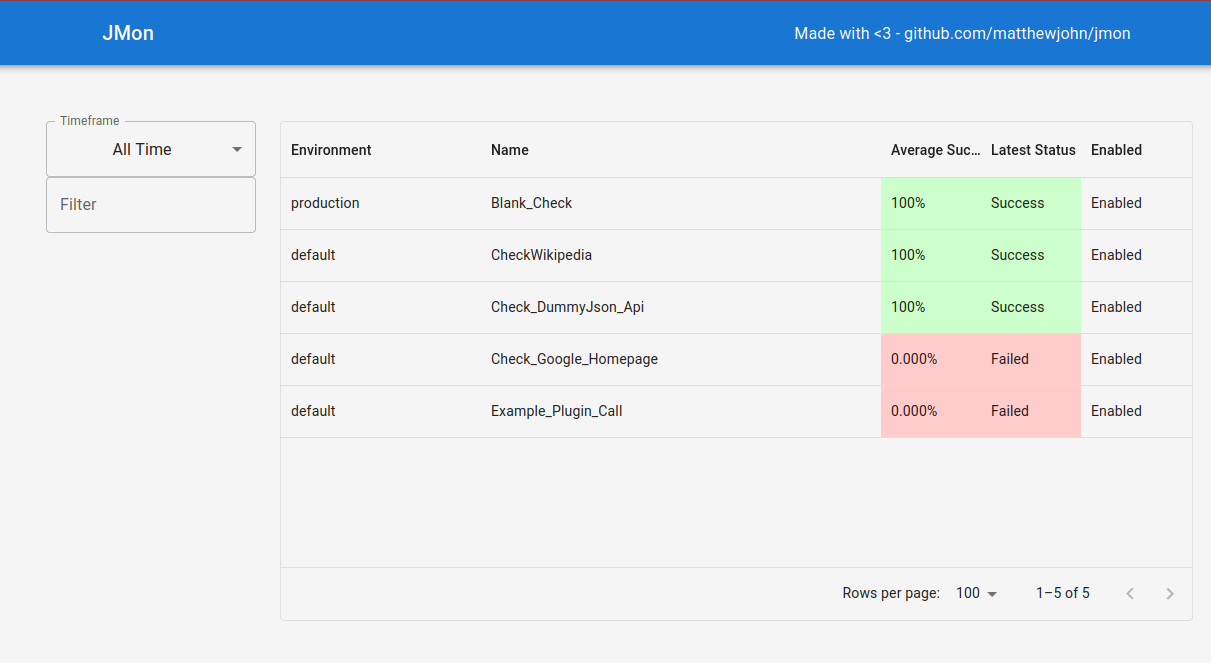
JMon provides a simple UI, showing check results:

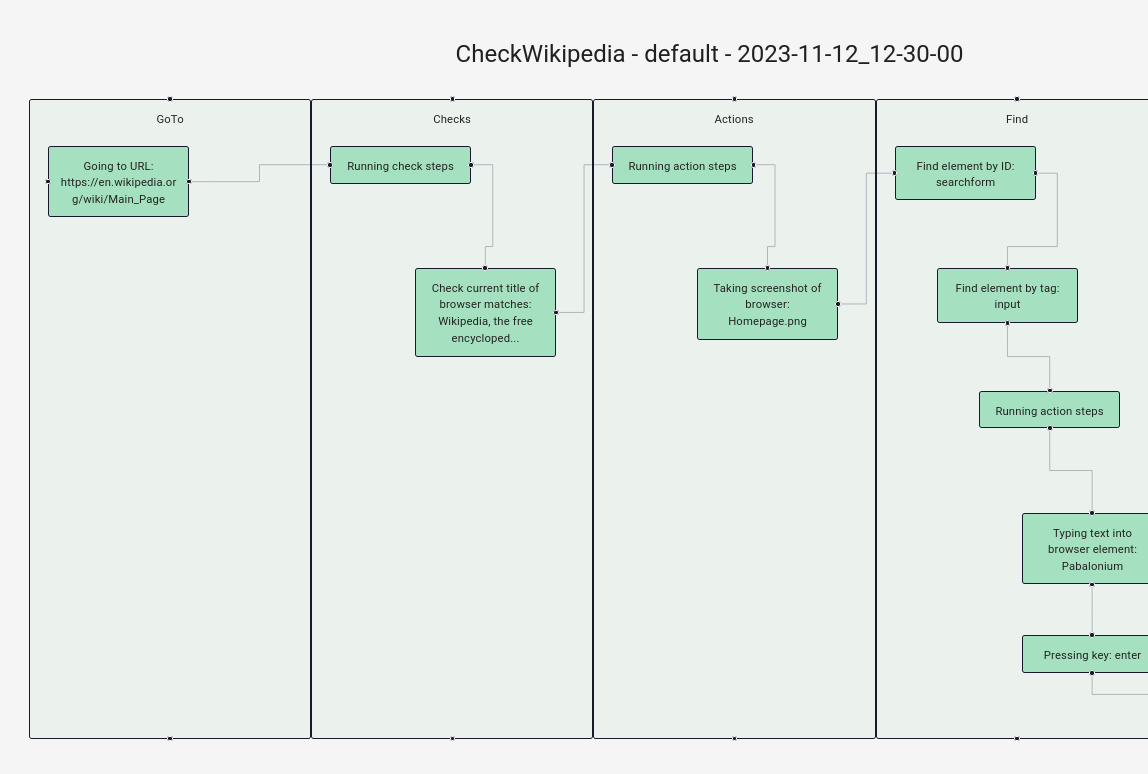
Since the structure of each check is based on pre-defined steps, the run execution can be displayed logically to the user:

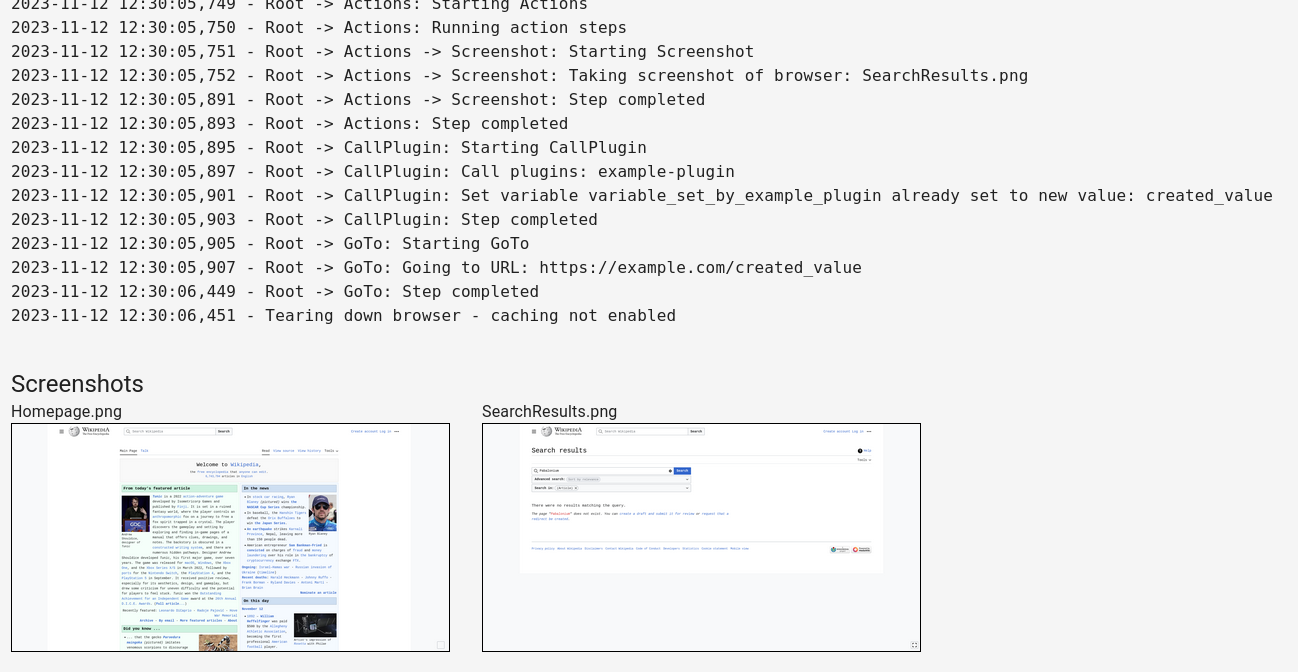
The raw log and any screenshots are also displayed for further debugging:

The Verdict
While JMon is in its alpha release, initial trials indicate its effectiveness as a potential alternative to AWS Synthetics. Beyond the immediate cost savings, JMon empowers organizations with the flexibility to deploy checks without the concern of financial constraints.
While the UI still requires quite a lot of refinement, JMon shows investigating alternatives is worthwhile, offering a cost-effective approach to synthetic checks in larger environments.
Irrelevant of whether it’s JMon or an alternative application, the main take away should be that running a solution like this yourself should be a serious consideration, when deploying vast instances of a particular AWS service.